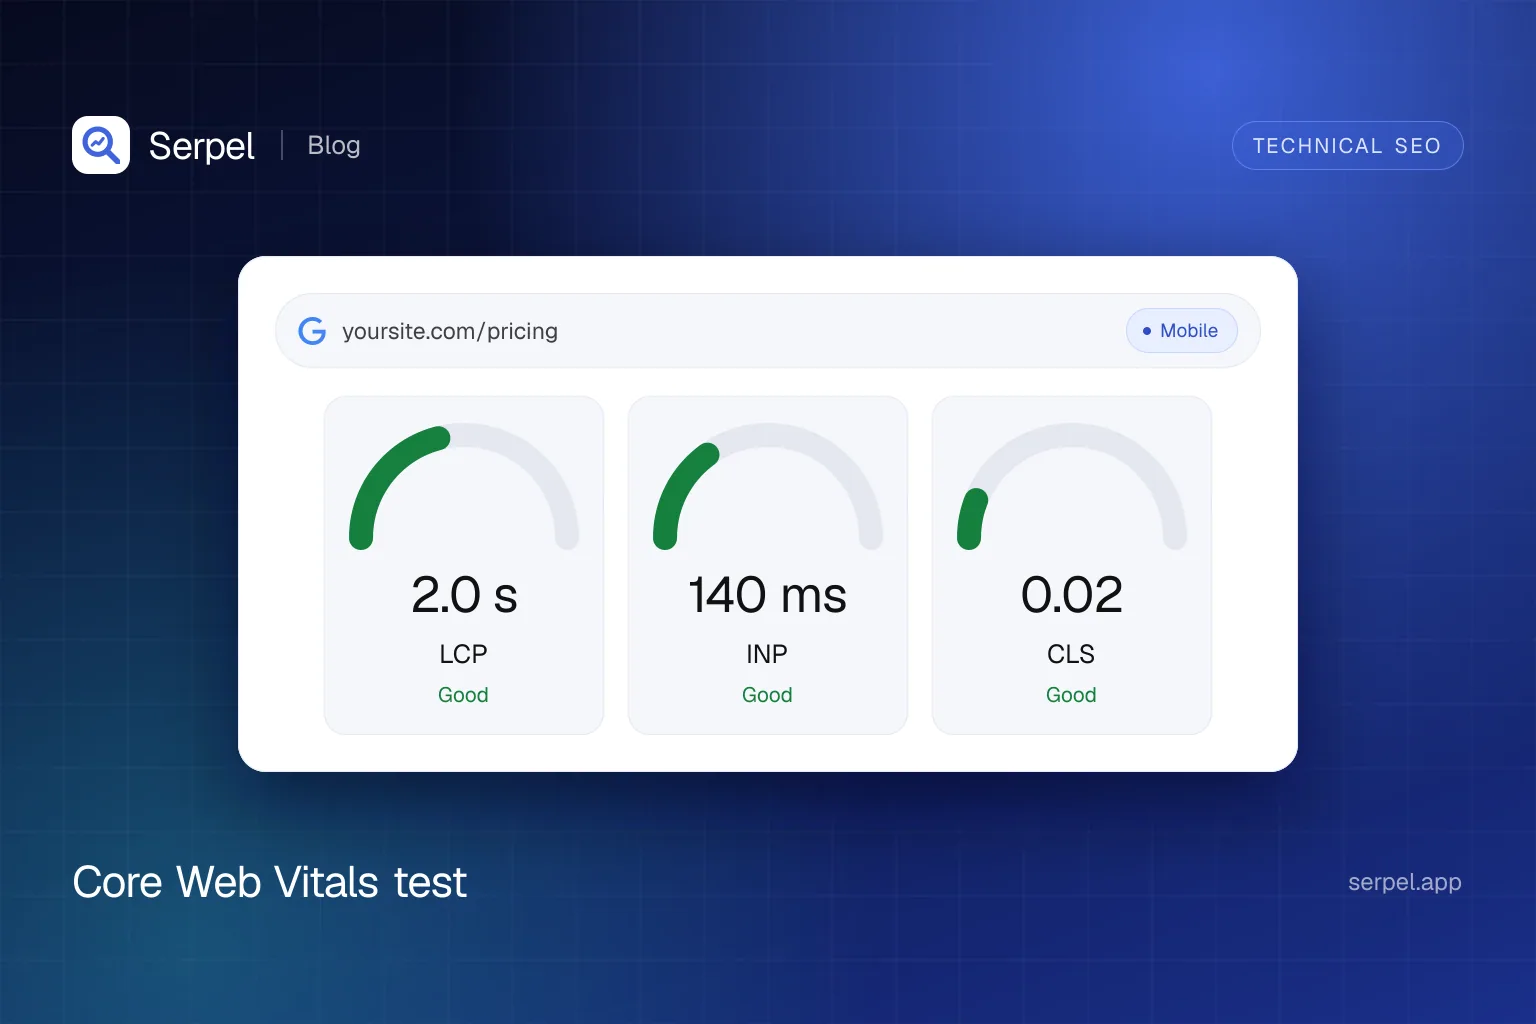
What does a Core Web Vitals test measure?
The Core Web Vitals are three user-centred metrics. Each has a “good” threshold, and a tool should only call a page passing when it meets the target at the 75th percentile of page loads, segmented by mobile and desktop, for all three.
| Metric | What it measures | Good | Needs improvement | Poor |
|---|---|---|---|---|
| Largest Contentful Paint (LCP) | Loading: when the largest image, text block or video in the viewport is rendered | 2.5 s or less | 2.5 to 4.0 s | Over 4.0 s |
| Interaction to Next Paint (INP) | Responsiveness: the worst interaction latency across clicks, taps and key presses | 200 ms or less | 200 to 500 ms | Over 500 ms |
| Cumulative Layout Shift (CLS) | Visual stability: the largest burst of unexpected layout shifts | 0.1 or less | 0.1 to 0.25 | Over 0.25 |
INP became a Core Web Vital and replaced First Input Delay on 12 March 2024. Google Search Console dropped FID the same day. Hovering, zooming and scrolling do not count towards INP.
Google’s page experience documentation says Core Web Vitals are used by its ranking systems. It also says that good scores do not guarantee a top ranking and that there is more to page experience than the scores alone. Treat the metrics as a quality bar, not a shortcut.
Lab data or field data: which one should you trust?
Every Core Web Vitals tester falls into one of two groups. Field tools report what real visitors experienced. Lab tools load the page once in a controlled setup. web.dev recommends using field data to prioritise work and lab data to debug and to test changes before release.
| Aspect | Lab data | Field data |
|---|---|---|
| Source | A Lighthouse run on one device, network and location | Real Chrome users, collected in the Chrome UX Report (CrUX) |
| Metrics | LCP and CLS. Total Blocking Time stands in for INP | LCP, INP and CLS at the 75th percentile |
| Best for | Debugging and checking a fix before it ships | Deciding which pages need work and whether you pass |
| Availability | Any URL you can load | Only pages and origins with enough eligible traffic |
The numbers differ for good reasons. A lab run usually starts with a cold cache, while real visits include cached loads. Field LCP stops tracking larger elements once the user interacts. INP depends on real interaction timing, which is why Lighthouse cannot measure it and suggests Total Blocking Time as a proxy.
Field data has its own limits. A page must be publicly discoverable and have enough visitors, and the exact number is not disclosed. Only desktop Chrome and Chrome on Android contribute, as the CrUX methodology explains. Chrome on iOS, Android WebView apps and other Chromium browsers do not.
How do you test Core Web Vitals?
PageSpeed Insights
Enter a URL and PageSpeed Insights shows field data from CrUX for the previous 28-day collection period at the 75th percentile, plus Lighthouse lab data, for mobile and desktop. If a URL has too little data it falls back to the whole origin. The page passes the assessment when the 75th percentile of all three metrics is good. When INP data is missing, LCP and CLS decide.
Google Search Console
The Core Web Vitals report uses CrUX field data, split by mobile and desktop. It groups URLs with a similar experience, and the group’s status is set by its worst metric. Use it to find which page types fail across the site.
Lighthouse and Chrome DevTools
Lighthouse runs in the DevTools Lighthouse tab, from the command line, as a Node module or inside PageSpeed Insights. It is the right tool for finding the LCP element and long tasks and for confirming a fix straight after a deploy.
The CrUX API
The CrUX API returns field data for a URL or an origin and needs an API key. Google documents a limit of 150 queries per minute per project. The 75th percentile is under percentiles.p75 for each metric.
curl -s --request POST "https://chromeuxreport.googleapis.com/v1/records:queryRecord?key=$CRUX_API_KEY" \
  --header "Content-Type: application/json" \
  --data '{"url":"https://example.com/","formFactor":"PHONE","metrics":["largest_contentful_paint","interaction_to_next_paint","cumulative_layout_shift"]}'
Your own users
The web-vitals library measures the three metrics in your visitors’ browsers, so you see your own audience, including browsers CrUX ignores.
import { onCLS, onINP, onLCP } from 'web-vitals'

function sendToAnalytics(metric) {
  const body = JSON.stringify({
    name: metric.name,
    value: metric.value,
    rating: metric.rating,
    id: metric.id,
  })
  navigator.sendBeacon('/analytics', body)
}

onCLS(sendToAnalytics)
onINP(sendToAnalytics)
onLCP(sendToAnalytics)
Serpel
With every crawl, Serpel’s site audit asks PageSpeed Insights to measure the home page and a small, fixed number of the most-linked indexable pages, on mobile and desktop. For each URL and device it stores the performance score, the field values for LCP, INP and CLS and the lab values for LCP, CLS, Total Blocking Time, First Contentful Paint and Speed Index.
Findings follow a fixed order. Serpel rates the URL’s field value against the thresholds above, falls back to origin-level field data when the URL has none, and only then uses the lab value for LCP and CLS. It reports the worse of mobile and desktop. If PageSpeed Insights is unreachable or the quota is used up, the crawl still finishes and the audit notes that the vitals could not be measured.
serpel crawl start --project <project-id> --wait
serpel audit web-vitals <crawl-id>How do you read a PageSpeed Insights report?
Start at the top. The field section answers whether real users have a good experience. It shows the page itself or, when the page has too little data, its whole origin, and it has separate results for mobile and desktop, which can differ a lot. Only these field values decide the Core Web Vitals assessment.
The lab section below is a single Lighthouse run. Its performance score summarises lab metrics and does not decide the assessment. Use the diagnostics for the metric that fails in the field instead of chasing a score of 100.
Which pages should you test first?
Test one URL per page template instead of every URL: the home page, a listing, a detail page, a content page and any checkout or form. Pages of a template share code, so a fix usually carries over. Start with the templates that get the most traffic or that Search Console flags. Test mobile first, because Google primarily indexes the mobile version of most sites.
How do you fix a failing metric?
Start with the metric that fails in field data, then use lab tools to find the cause. web.dev splits LCP into four parts. As a guideline, time to first byte and resource load duration should each take about 40% of the total, while resource load delay and element render delay should each stay under 10%.
| Metric | Likely cause | How to confirm | Fix |
|---|---|---|---|
| LCP | Slow first byte from redirects, uncached HTML or a slow backend | Time to first byte in the PageSpeed report | Deliver the HTML as fast as possible: cache it, avoid redirects and avoid unique URL parameters that miss the cache |
| LCP | The hero image is found late or lazy-loaded | The LCP element in Lighthouse, a loading="lazy" attribute on it, an image set only in CSS | Put the image in the HTML, never lazy-load it and add fetchpriority="high" |
| LCP | The main content is rendered by JavaScript | A large element render delay | Server-render or prerender the main content. See JavaScript SEO |
| INP | Long tasks block the main thread | The Performance panel in DevTools | Keep event callbacks light and split work into separate tasks |
| INP | Heavy rendering after an interaction | A large DOM, or styles changed and layout read in the same task | Reduce the DOM size and avoid forced synchronous layout |
| CLS | Images and videos without dimensions | Elements that jump when media loads | Set width and height or a CSS aspect-ratio |
| CLS | Ads, embeds or banners inserted late | Shifts in the DevTools layout shift regions | Reserve space with min-height or aspect-ratio, or load late content after a user action |
| CLS | Web fonts that swap and reflow text | Text that jumps when the font loads | Preload critical fonts and use font-display: optional or a matched fallback with size-adjust |
<img src="/images/hero.webp" width="1200" height="630" alt="Product dashboard" fetchpriority="high">If you build with Next.js, the framework handles part of this for images and fonts. The Next.js SEO guide shows the settings.
How long until a fix shows up?
Field data moves slowly because CrUX reports a 28-day window. After you fix a Search Console issue, fix validation monitors the URLs for 28 days. Confirm the change with a lab run on the same day, then watch the field numbers for a month before you call it done.
Frequently asked questions
Is Core Web Vitals a ranking factor?
Google says Core Web Vitals are used by its ranking systems. It also says that good scores do not guarantee a top ranking and that great page experience involves more than the scores. Fix failing pages, but do not expect the numbers alone to move you up.
What replaced FID in Core Web Vitals?
Interaction to Next Paint replaced First Input Delay as a Core Web Vital on 12 March 2024. FID looked at the first interaction only, while INP observes all clicks, taps and key presses during a visit.
Why do PageSpeed Insights, Lighthouse and Search Console show different numbers?
Lighthouse is a single lab run, while Search Console and the field section of PageSpeed Insights use real-user CrUX data from the last 28 days. Search Console also groups similar URLs. Differences between lab and field data are expected.
Why does PageSpeed Insights show no field data for my page?
CrUX only includes pages that are publicly discoverable and have enough visitors. PageSpeed Insights then falls back to origin-level data, and shows no real-user data if the origin lacks enough as well. Use lab data and your own measurements for low-traffic pages.
How can I test Core Web Vitals for a whole site?
Use the Core Web Vitals report in Search Console, which groups URLs by similar experience, or query the CrUX API for the origin. A crawl that measures a sample of key pages on every run helps catch regressions after a deploy.
Sources
- web.dev: Web Vitals, accessed 10 Oct 2026
- web.dev: Largest Contentful Paint (LCP), accessed 10 Oct 2026
- web.dev: Interaction to Next Paint (INP), accessed 10 Oct 2026
- web.dev: Cumulative Layout Shift (CLS), accessed 10 Oct 2026
- web.dev: INP becomes a Core Web Vital on March 12, accessed 10 Oct 2026
- web.dev: Why lab and field data can be different, accessed 10 Oct 2026
- web.dev: Optimize Largest Contentful Paint, accessed 10 Oct 2026
- Google Search Central: Understanding page experience in Google Search results, accessed 10 Oct 2026
- Search Console Help: Core Web Vitals report, accessed 10 Oct 2026
- Google PageSpeed Insights: About PageSpeed Insights, accessed 10 Oct 2026
- Chrome for Developers: CrUX methodology, accessed 10 Oct 2026
- Chrome for Developers: CrUX API, accessed 10 Oct 2026
- Google Search Central: Googlebot, accessed 10 Oct 2026
- Chrome for Developers: Lighthouse overview, accessed 10 Oct 2026
- GitHub: GoogleChrome/web-vitals, accessed 10 Oct 2026
Related reading
- Site auditSerpel runs a technical SEO audit with 94 checks, JavaScript rendering and Core Web Vitals, and explains every issue and its fix.
- Next.js SEO: the App Router guide to metadata, sitemaps and renderingNext.js SEO best practices for the App Router: metadata, sitemaps, robots, JSON-LD, rendering and Core Web Vitals, with working code for Next.js 15 and 16.
- JavaScript SEO: how Google crawls, renders and indexes JavaScriptJavaScript SEO explained: how Googlebot crawls, renders and indexes JS, which rendering strategy to choose and how to test what Google sees.
- CLIThe Serpel SEO CLI runs rank checks, site audits and AI visibility checks from your terminal, with JSON output, documented exit codes and CI support.